Non-uniqueness of optimal initial perturbation
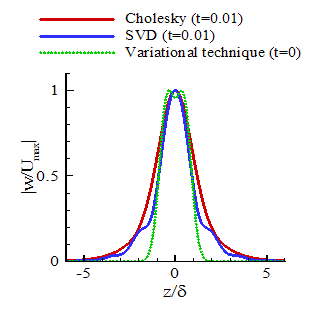
Amplitudes of different optimal vectors are shown in the figure below: we used SVD or Cholesky decomposition (shown by blue and red lines accordingly) to decompose the Gram matrix. Additionally, the variational approach yields the optimal vector corresponding to the energy growth at t=0. We present here the latter together with two other vectors, which are calculated for a short time interval of t=0.01.
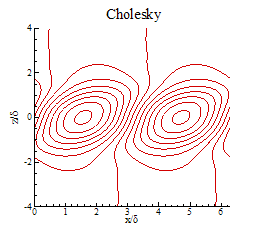
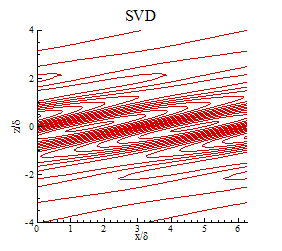
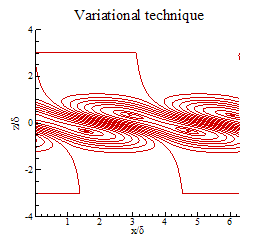
In next 3 figures the corresponding streamfunctions are presented for each initial optimal vector. We can clearly see different patterns of each of them.